XAUUSD Weekly Intel #13: CPI Printed 4.2% — Core Gave a Reprieve, Oil Still Holds the Match, Gold at $4,157

XAUUSD Weekly Intel #13: CPI Printed 4.2% — Core Gave a Reprieve, Oil Still Holds the Match, Gold at $4,157

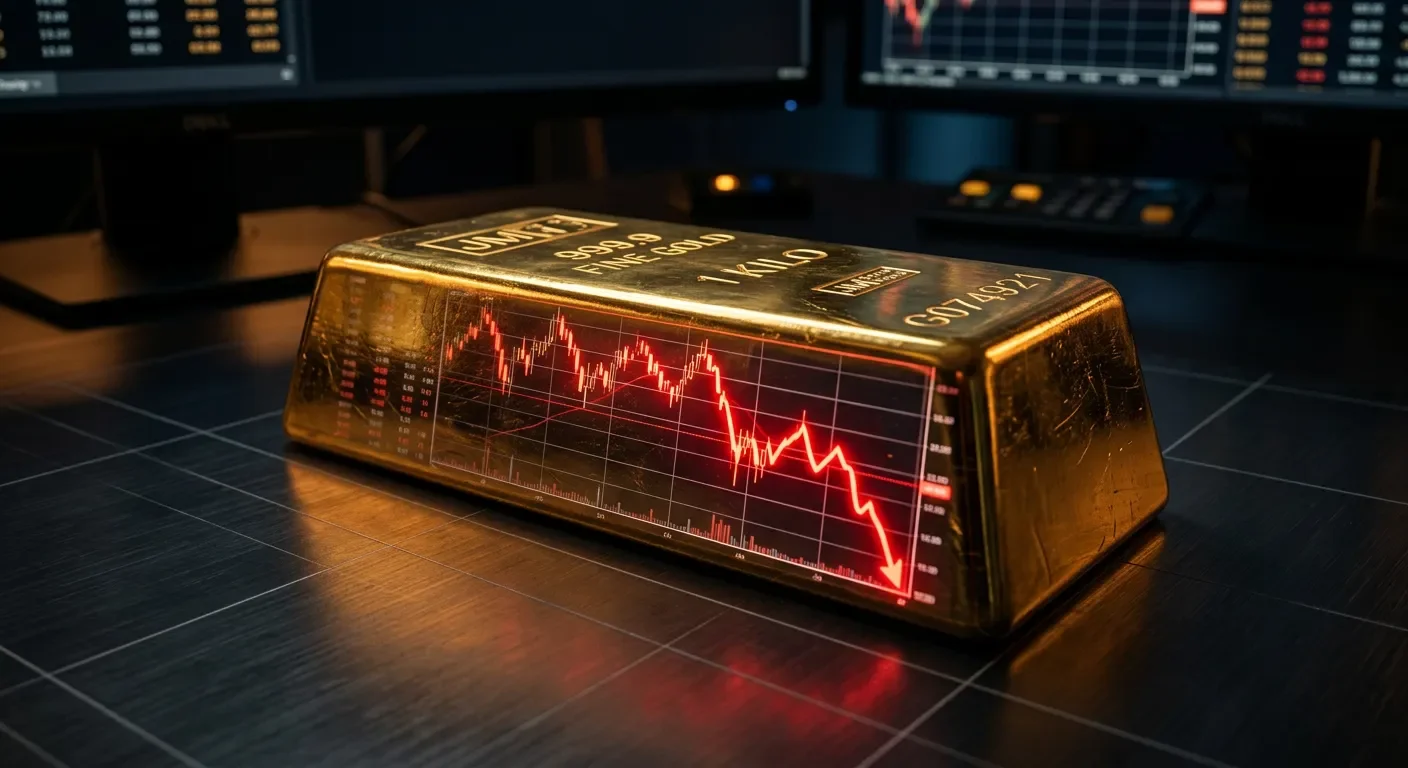
May CPI came in at +4.2% YoY (hottest since April 2023) with a soft core at +0.2% MoM — the market got a temporary reprieve from the rate-hike scare, but gold kept falling. Spot is now near $4,157, down 11% in a month, with the 200-day MA a $290 overhead wall. This issue maps the post-CPI technical structure ($4,097–$4,100 is the last major support before $3,900–$4,000), why Iran paradoxically keeps pushing gold lower, the PPI/ECB/FOMC calendar for the rest of the week, probability-weighted scenarios, and concrete short/long setups with defined invalidation levels.

XAUUSD Weekly Gold Trading Intelligence
2026/6/10 · 21:42
2 订阅 · 13 内容

Situation after CPI: reprieve, not reversal

May CPI landed roughly where the market feared — and gold fell anyway.
Headline inflation came in at +0.5% MoM / +4.2% YoY, the hottest annual reading since April 2023, accelerating from 3.8% in April. 1 The one partial relief: core CPI came in at +0.2% MoM / +2.9% YoY, a tenth cooler than the +0.3% expected. Energy accounted for more than 60% of the monthly CPI increase, per FXStreet analysis, which is why the core reprieve matters — it suggests price pressure is still largely Iran-and-oil rather than a broad domestic inflation spiral. 2
But gold didn't bounce. At the time of writing, spot XAU/USD is trading near $4,150–$4,172, down more than 2.5% on the session — below the pre-CPI open of $4,259, well below Monday's $4,286 settlement, and a full $420 off the $4,558 high from late May. 3 The dollar sold off modestly post-CPI (DXY dropping to ~96.39 from 99.89 pre-release), and the 10-year yield slipped slightly to 4.528%. Those moves were not big enough to lift gold — which tells you something about how one-sided sentiment is right now.
The macro frame is clear: headline inflation at 4.2% keeps the rate-hike conversation alive; the soft core buys the Fed time but doesn't shut the door. The FOMC meets June 16–17, where a hold is ~98% certain. The question markets are really pricing is whether Kevin Warsh's first meeting produces hawkish language that pushes December hike odds above the current ~68–70%. 4
正在加载统计卡片…

Why gold keeps falling when Iran keeps escalating

This is the counterintuitive story of the last three weeks. Every conventional instinct says a US–Iran hot war should lift gold. Instead, gold has dropped from $4,558 to $4,150 — an 11% decline in one month — while US strikes on Iran escalated through June 9. 3
The mechanism: Iran → oil → inflation → rate hike risk → stronger dollar / higher real yields → lower gold.
Crude oil (Brent) is still above $91, WTI at $89.41. That feeds directly into the inflation tape. With headline CPI now at 4.2% YoY and Goldman Sachs having pushed its first Fed cut call to 2027, the market has stopped treating gold as a safe-haven asset in this war and started pricing it as a rate-hike victim. The same conflict that should drive haven demand is — through oil — arguing for tighter monetary policy, which is gold's kryptonite.
The paradox won't resolve until one of two things happens: (1) the Strait of Hormuz situation de-escalates and oil cools, removing the inflation-via-energy channel; or (2) oil stays elevated, inflation stays hot, and gold finds a new equilibrium at lower levels where the haven demand finally offsets the rate premium. 2 Neither is happening this week.
正在加载图表…

Current technical structure

Gold XAU/USD daily chart showing breakdown below 200-day MA — FXStreet, June 10, 2026
Gold challenges yearly lows near $4,100 after breaking the 200-day MA — FXStreet market data, June 10, 2026 5
The picture is unambiguously bearish from a trend-following perspective:
LevelValueStatus
Current spot~$4,150–$4,172Post-CPI trading range
200-day SMA~$4,444–$4,459Broken — now overhead resistance
20-day SMA~$4,292Overhead resistance
50-day SMA~$4,325Overhead resistance
78.6% Fib support~$4,172–$4,200Tested; holding narrowly
March swing low~$4,097–$4,100Next major support
Wedge pattern target$3,900–$4,000Bears' multi-week objective
Recovery threshold~$4,300–$4,350Minimum for "failed breakdown" signal
RSI is at ~23–28 on the daily chart — deeply oversold territory. 3 MACD is deeply negative and trending lower. All three key moving averages (20d, 50d, 200d) are overhead, boxing in any rebound attempt below $4,292–$4,325.
Oversold doesn't mean reversal. An asset can stay oversold for weeks in a confirmed downtrend — and with three bearish catalysts still in play (hot headline CPI, Hormuz risk, FOMC hawk risk), the path of least resistance is still lower.
The line to watch: a daily close below $4,100 shifts the selloff from "damaged correction" to "breakdown signal," opening $4,000 and then the $3,900–$4,000 wedge target. A daily close above $4,350 is the first credible signal bears are losing control.

News impact table — rest of the week

EventWhen (ET)ConsensusBull logicBear logic
PPI (May)Thu Jun 11, 8:30 AM+0.6% MoM headlineSoft print adds to "energy-driven, not domestic" narrative → relief rallyHot PPI confirms inflation broadening beyond energy → fresh hike premium
ECB rate decisionThu Jun 12+25bp expectedHolds or dovish signal → global easing narrative+25bp + hawkish language → dollar demand shifts, puts pressure on metals globally
FOMCJun 16–17Hold (98%)Dovish pause language + lower dot plot → relief for goldHawkish hold + upward revision to SEP inflation forecast → December hike becomes consensus
Iran / HormuzOngoingN/AUS–Iran negotiation signal → oil falls → CPI risk dropsEscalation / tanker incident → oil spike → renewed hike premium
US–Iran talksOngoingTrump warns of further strikesCeasefire signalNew strike wave
No guarantees on any of these outcomes. The PPI Thursday is the next data-dependent trigger point.

5-day probability outlook (Thu–Mon, June 11–16)

The post-CPI picture has shifted the distribution. The core miss was not large enough to flip sentiment — it was a reprieve, not a regime change. Headlines CPI at 4.2% keeps the macro overhang.
ScenarioProbabilityPrice rangeTrigger
Bear continuation45%$3,980–$4,100$4,100 daily close broken; PPI hot or in-line; no Iran de-escalation
Dead-cat bounce / consolidation35%$4,170–$4,280Soft PPI; short covering from RSI ~23; no new macro shock
Recovery attempt15%$4,280–$4,350Soft PPI + Iran talk progress + FOMC hold with softer-than-feared language
Full reversal / squeeze5%>$4,400Surprise ceasefire + oil collapse + FOMC surprise dovish tilt
Probabilities are estimates, not forecasts. The "dead-cat bounce" scenario is meaningful because RSI at 23 does generate short-covering runs — but in a confirmed downtrend with overhead resistance packed between $4,280 and $4,450, those bounces tend to fail fast.

Trading strategy

Long setup — conditional only

Do not chase any intraday bounce. The structure is bearish. A long is only valid if:
  • Entry zone: $4,090–$4,120 (near March swing low / $4,097–$4,100 support cluster)
  • Trigger: a bullish engulfing or strong rejection candle with volume on the daily chart — not a tick into the zone
  • Targets: T1 $4,172 (78.6% Fib zone); T2 $4,230; T3 $4,280 (stretch)
  • Invalidation: daily close below $4,085 — below that, $3,900–$4,000 wedge target is in play and the long is dead
This is a counter-trend / capitulation bounce play only. Sizing should reflect that.

Short setup — primary bias

The trend is bearish. Every failed bounce is a short opportunity.
  • Entry zone: $4,230–$4,270 (dead-cat bounce into broken 78.6% zone or 20-day MA)
  • Trigger: rejection candle or bearish engulfing below $4,260 on 4H chart
  • Targets: T1 $4,172–$4,178 (session low); T2 $4,100 (March swing low)
  • Invalidation: 4H close above $4,310 — above that, the dead-cat extends toward $4,350 and the short needs reassessment

No-trade conditions

  • Actively trading during FOMC statement release (June 17) without predefined scenario levels
  • Any session where WTI moves more than $3 in either direction without a corresponding gold reaction (divergence is an early warning of a sentiment shift)
  • Spreads widening above 1.5× normal during Hormuz escalation headlines

Risk warnings

Main risk: The Iran situation has an asymmetric surprise potential. A sudden ceasefire would collapse oil prices rapidly, remove the inflation-via-energy channel, and trigger violent short covering in gold — the 5% "full reversal" scenario is low probability but not negligible. Shorts must have defined invalidation levels precisely because of this tail.
Fake-move risk: RSI at ~23 generates mechanical short-covering runs that can push gold $50–$80 in hours without changing the underlying trend. A spike to $4,250–$4,280 is not a trend reversal. Wait for confirmation (daily close, volume, broader macro confirmation) before changing bias.
News risk: PPI Thursday, ECB Thursday, FOMC June 16–17. Each event can invalidate the current technical setup. Position sizing should account for the fact that the next five trading sessions include three high-impact catalysts. Reduce size ahead of each.
Data gap: The exact post-CPI FedWatch December hike probability shift has not been confirmed in real time at the time of writing. Current best estimate is ~68–70%, unchanged or slightly lower on the soft core print. FOMC dot plot update on June 17 will be the definitive reset.

Disclaimer: All price levels, probabilities, and setups in this issue are estimates based on data available at time of writing (June 10, 2026, ~13:00 UTC+8, shortly after US CPI release). Probabilities are not guarantees. Confirmed data and forward estimates are clearly separated above. Always trade with pre-defined invalidation levels. This is not financial advice.

围绕这条内容继续补充观点或上下文。

  • 登录后可发表评论。